You can try the ExecutionPlatform with our demo systems. Each demo consists of a VS Code instance that is connected to an ExecutionPlatform with a RP2040 microcontroller in it.
You can view the schematics of the RP2040 integration. The integration uses the same basic circuitry as the PICO board and makes all free pins available for your use in the ExecutionPlatform (nets GPIO* and Analog*).
Start a demo
To start your demo, go to try online and enter your email address. Once you click the button, a demo instance is automatically prepared for you. After a few minutes you will receive an email with a link to start your demo. This link opens a dedicated VS code instance in your browser. You can use it for up to one hour. After that, it is automatically discarded. If you need more time to evaluate, you can just reuse the link from your email to start yet another instance.
Using the demo
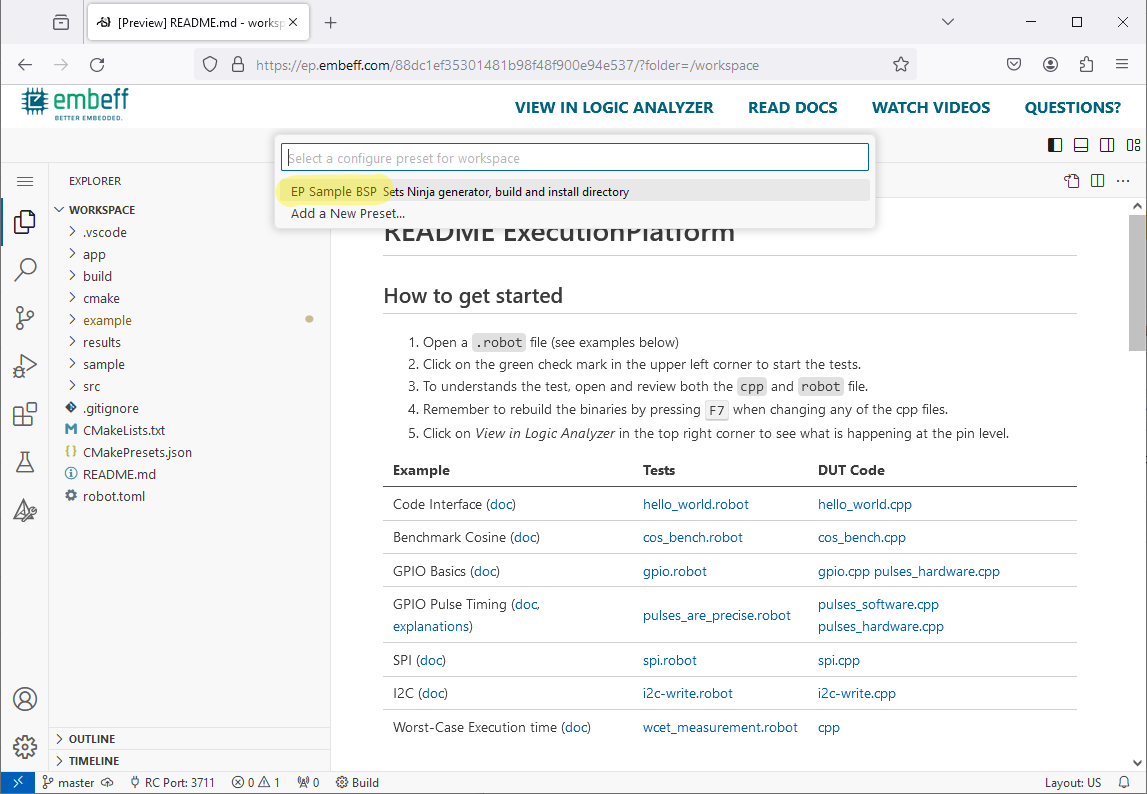
When you first open VS Code, you need to select the EP Sample BSP preset to apply all build settings for the RP2040.
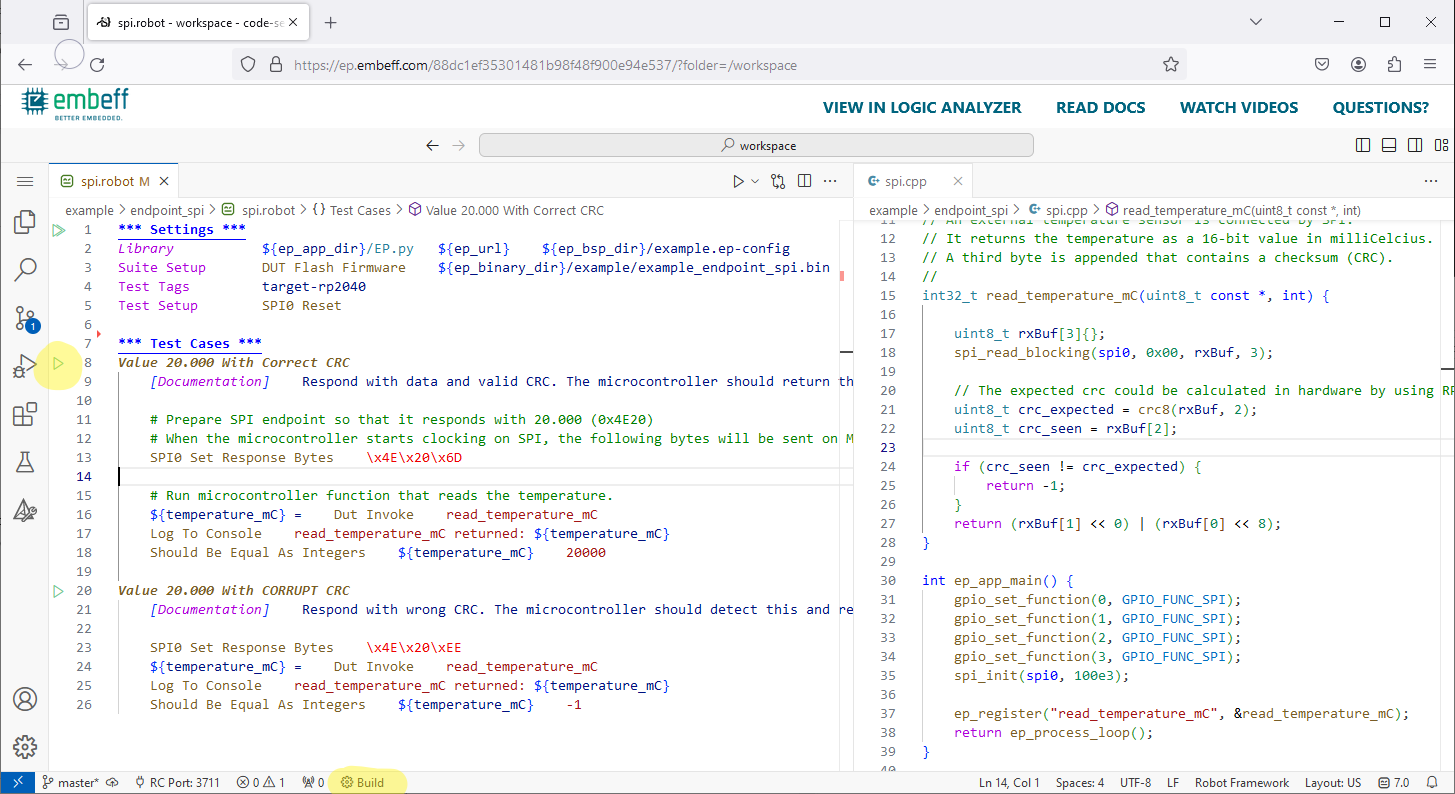
To start evaluating, we recommend one of our examples that are listed in the README.md. Each example consists of a .robot file that contains the test sequence and a .cpp file that contains the microcontroller code that is the object of your test.
Typically you want to open both the files and place them next to each other. Left to each test name you find the symbol to run it. Make sure to click on Build to compile the latest changes from your source code. Our examples always use DUT Flash Firmware to program the resulting binary to the microcontroller in one of the first steps of a test.
After running a test you can open the Terminal to view the test results or locate example/log.html in the explorer on the left side and download a detailed test report.
Debugging
In case something does not work as expected, you might want to debug it to find out more. With the ExecutionPlatform, you can debug both the source file on the microcontroller and the robot sequence. We prepared an article for you how debugging works on the ExecutionPlatform.
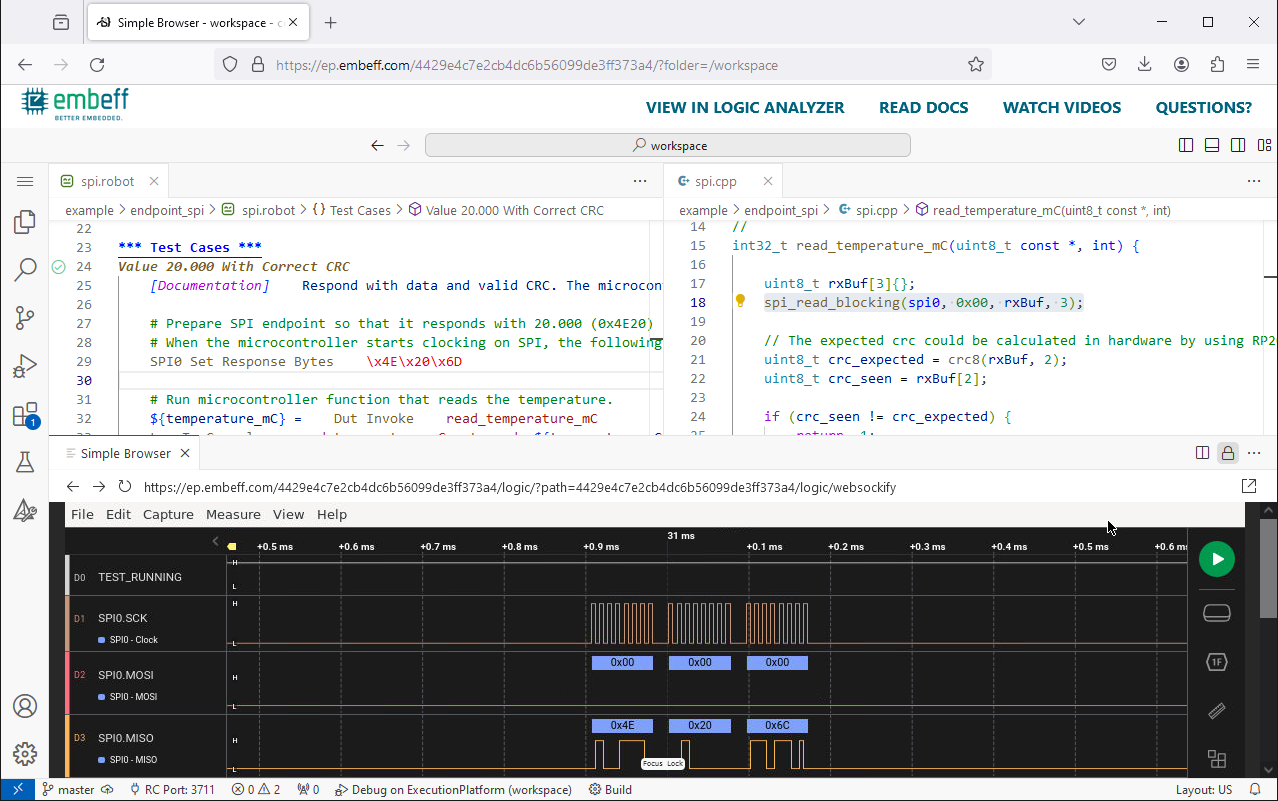
Open a logic analyzer
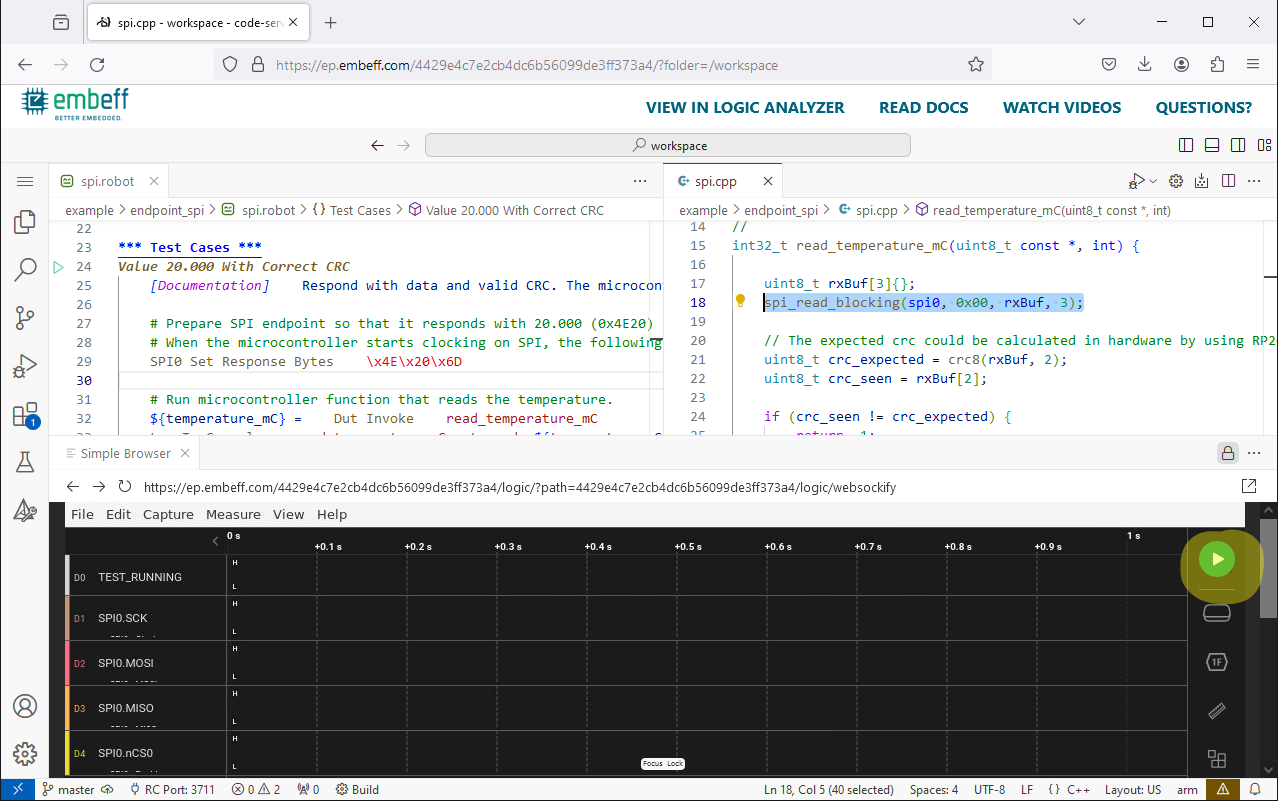
All of our demo devices are connected to a Saleae Logic 8 logic analyzer. This allows you to inspect any microcontroller pin you want at runtime.
You have two options to open the Logic Analyzer
- Click on VIEW IN LOGIC ANALYZER in the menu bar to open a new browser window.
- Press F1, enter Tasks: Run Tasks, press Return and select Open Saleae Logic Analyzer. This will open a window inside VS Code.
The selection of signals you see is set by the active configuration. You find this configuration in the Library EP.py setting at the beginning of your test sequence. For each .ep-config file there is a .ep-config.yaml file showing the mapping. If you want to look up the mapping for example.ep-config, press CTRL-P and search for example.ep-config.yaml. Look up our Analyzer Endpoint documentation for more details.
To capture the pin behavior during a test, you need to
- Start the capturing in the Saleae window
- Start the test
- Stop capturing (if not happening automatically) in the Saleae window
You can then inspect the results.
What next?
The steps described above are intended to get you ready on your own. If you need any assistance, let us know by sending an email to support@embeff.com.