
We help you to work from anywhere on hardware-related code.
Effective Remote Work for Cortex-M Microcontroller
Debug your code with J-Link.
Stimulate and observe pin behavior.
Watch any pin behavior with a logic analyzer.
Learn more
Get your powerful environment for remote work.
1 | Integrate your microcontroller. 
Use up to 24 Analog Outputs. |
2 | You choose ExecutionPlatform hardware for your needs.  Standalone One microcontroller. Use it on your desk. 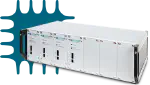 Rack Different microcontrollers. Multiple parallel users. Mountable in your 19" rack.  Hosted We host the hardware. Scales to your needs. Secure access from anywhere. |
Debug your code
Use the integrated SEGGER J-Link for powerful debugging.
Debug from anywhere with network-based access.

Stimulate and measure pin behavior
Call any function running on the microcontroller with our Code Interface. Invoking individual pieces of hardware-dependent code to evaluate them in isolation.
Stimulate and observe pin behavior with our peripheral-specific Endpoints. Easily specify fault injection scenarios.
Write short sequences in Robot Framework for your scenario.
Use tests to interactively explore the behavior of your Microcontroller.
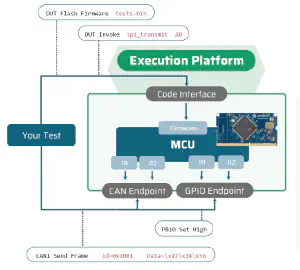
Observe any pin behavior
Programmable logic analyzer interface.
Choose up to 8 microcontroller pins for observation.
No cabling. Reconfigure pin usage for each test.
What our customers say.
"The very good insight into the microcontroller behavior down to the pin is particularly helpful in day-to-day work, and the freely programmable logic analyzer and integrated debugger allow complex behavioral scenarios to be fully displayed and understood. The fact that this is possible without unplugging cables and also from the home office makes the ExecutionPlatform a valuable tool for me."
Fabian Frese
Senior Software Architect
Try the ExecutionPlatform.
Right now. From your browser.
Learn more in our monthly webinar. With room for your questions.