int MultiplyWithPI(int input) {
    return input * 3.14159265359f;
}
How long will this function take to execute on our target hardware?
This blog post will introduce a service to answer this question in a convenient way.
But first, let us examine why and when this question typically arises. What is problematic about it?
Why we need runtime measurements
There are several reasons why we need runtime measurements quite commonly when developing embedded software:
- Knowledge of exact execution time is required to check against hard real time requirements.
- Several implementations are possible and you want to check which one is fastest.
- Check if execution time is deterministic (stays the same for all input arguments), e.g. to mitigate timing side channel attacks.
- Facilitate a decision on using an external library.
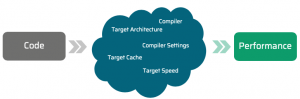
The runtime of a given piece of code is highly dependent on your target and the way the code is getting compiled. To get reliable results, you therefore need to measure the runtime on your specific target.
Traditionally, to accomplish this requires several steps:
-
- Define the problem
- Define the function you are interested in.
- Define the conditions (parameters) for which the function should be evaluated.
- Provide the glue
- Integrate some form of timer or performance unit.
- Provide everything to allow your program to run (linker scripts, system startup).
- Compile everything for your embedded target.
- Use your hardware
- Flash the binary.
- Use debug or trace hardware to gather the results.
- Define the problem
This process is tedious and time-consuming. Or rather was tedious: We developed a service to make this more convenient.
Simplify your life
barebench Cloud is a web-based service to measure code runtime for embedded microcontrollers. With barebench, you only have to define the problem. All other steps are handled automatically.
You do not need debug/trace hardware, nor you need the embedded targets you want to test for. There is no simulation involved to compute the results. All benchmarks are run on the chosen physical target.
And it is free to use. After registration, you can immediately start to examine your code in terms of performance.
Let’s get back to our introduction and see how we can measure the performance of this code. The function is only multiplying its integer input with a floating point value.
int MultiplyWithPI(int input) {
    return input * 3.14159265359f;
}
The first step is to define this function within the upper left code editor. We only want to benchmark this single function, so we only need one code editor.
In the next step, we need to tell barebench about the function we want to measure and the input parameters it should use. This is done in the lower left benchmark editor.
bb_register(int MultiplyWithPI(int));
void bb_entry() {
    for (int i=-9;i<=9; i++) {
        bb_invoke(MultiplyWithPI, i);
    }
}
The helper commands bb_register and bb_invoke are further described in the documentation.
This code will invoke our function for the range [-9..+9].
The last thing we need to define is called a configuration and tells barebench, which compiler and settings should be used for compilation and which target to use for execution.
Currently supported are recent releases of the arm gcc compiler. Publicly available targets are STM32F4 and STM32L4 controllers with different settings.
For this example, we want to run the function on the STM32L4 target. The underlying Cortex-M4F provides a Floating Point Unit in hardware. The first configuration is using this FPU. The second configuration disables this hardware unit, so that the compiler needs to emulate the floating point operations in software (this is called Soft FPU). What are the performance implications?
We are now ready to start the benchmark. To open this example directly in barebench click here. The code is executed on the chosen target. The runtime is measured with core cycle precision.
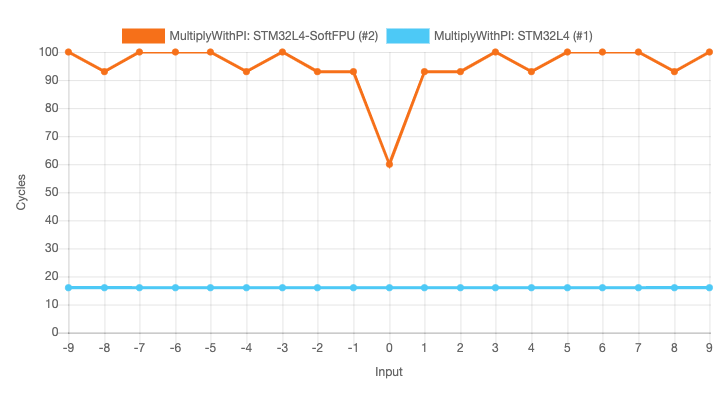
We see that the FPU configuration has the same runtime for all chosen input arguments. The Soft FPU configuration is slower and – critically – very much dependent on the input parameters.
Wrap up
Although the example shown is a very simple one, it already demonstrates that not only the code itself, but also many other factors determine its performance. This is especially true for the huge range of embedded architectures and compilers.
The principal aim of barebench is to help you navigate this complex mapping successfully.
Here are a few other interesting examples:
- any_of element check: STL-algorithm vs naive loop-implementation
- Compute a vector length: CMSIS vs STL-algorithm vs naive
- Observe pipeline optimization effects
We hope the tool can help you make better – and data based – decisions. Please be aware that the cloud website is in a beta stage. Reach out to us if you have any feedback!