When working with the ExecutionPlatform, you have the possibility to debug different things.
Depending on what we are searching for we need to check code that is running on MCU or to look whether test case is working correctly.
When to choose which option
The recommend approach is to start with the test case to identify spots that do not behave as expected and then look deeper at those places.
As an example, look at the values passed to DUT Invoke and the value returned from it. When inputs and outputs are correct you don’t need to debug the MCU code, you need to check your test.
In case of unit tests both test and code under test are running on the MCU. In this case MCU debugging is the right/only option.
Debugging robot tests
You can run the whole suite in debug mode, but usually it is enough to run a single test in debug.
The only difference is how you start the debugger. For suite you need to do the same steps as described below but click on Run Suite in the first line of the robot-file instead.
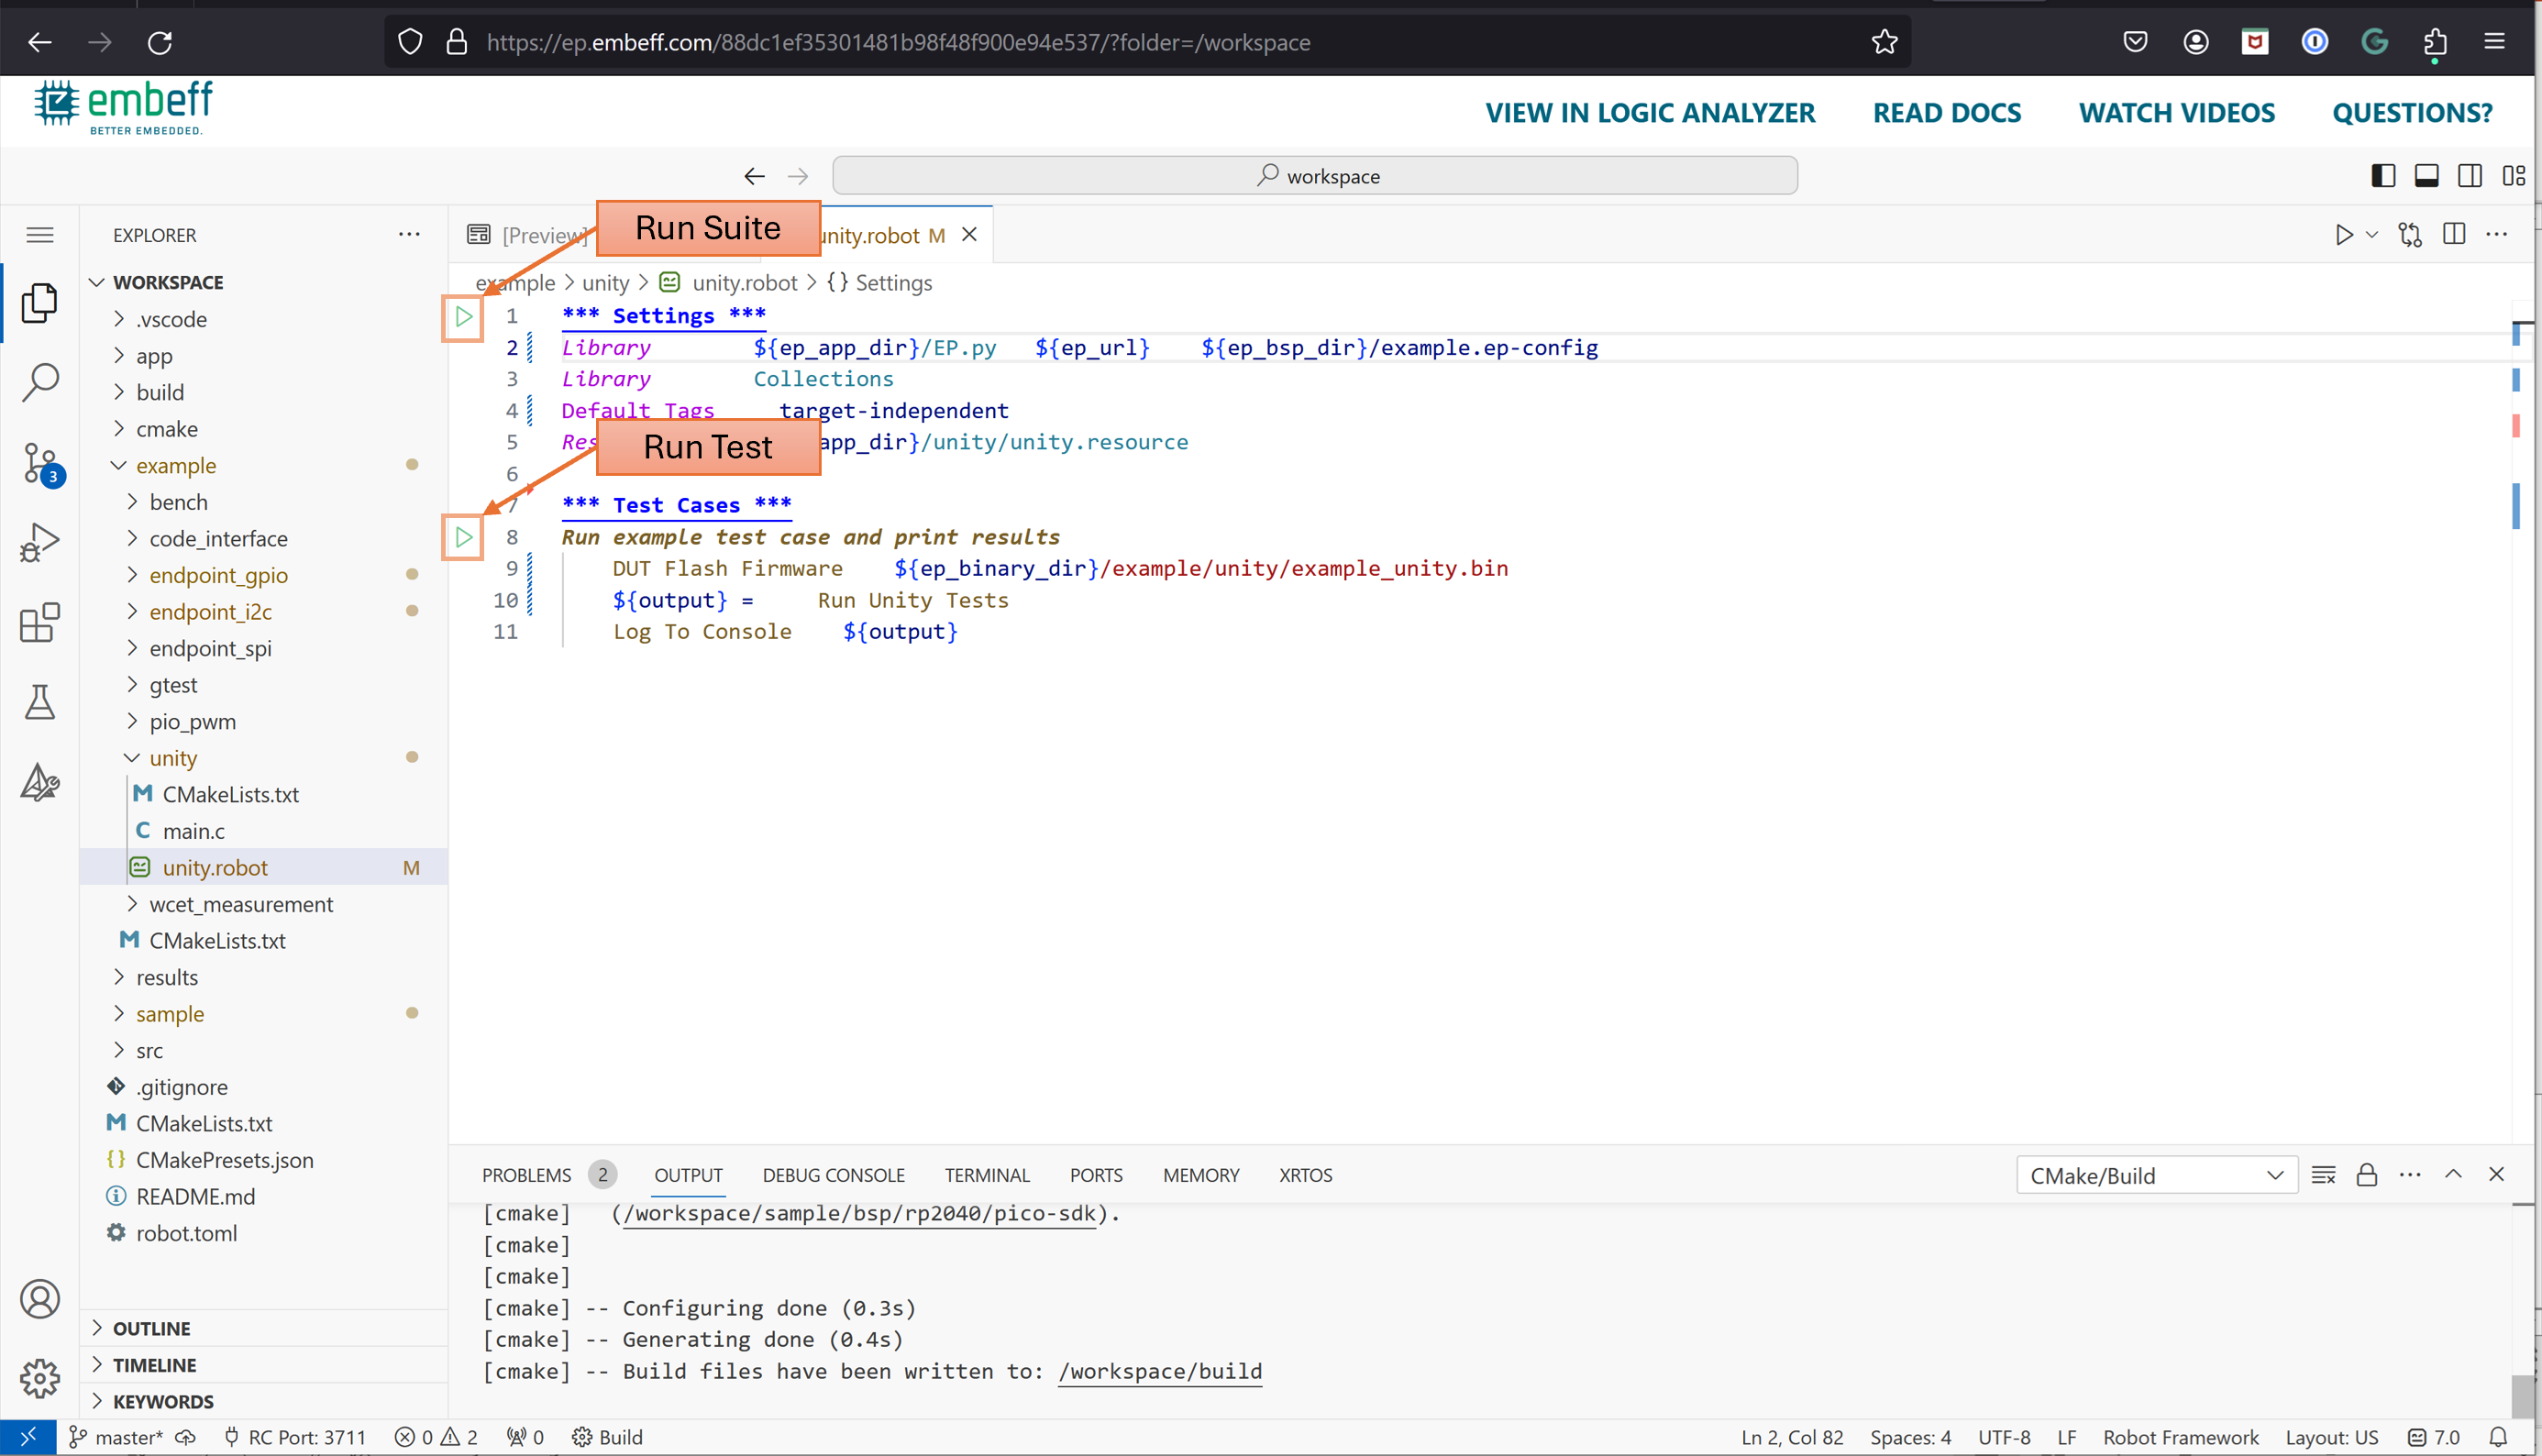
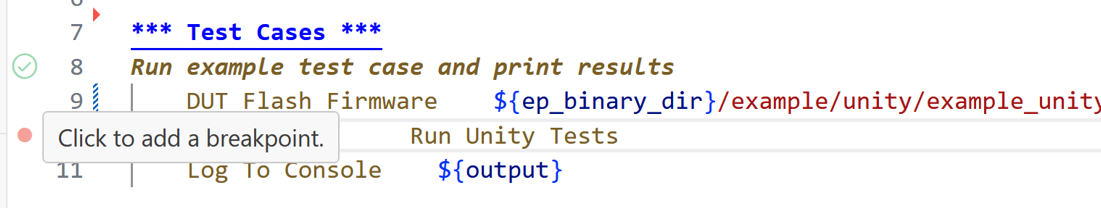
To start debugging test cases just put a breakpoint at the line where you would like the execution to pause.
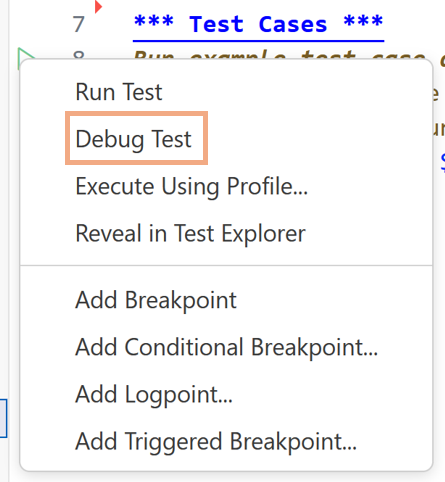
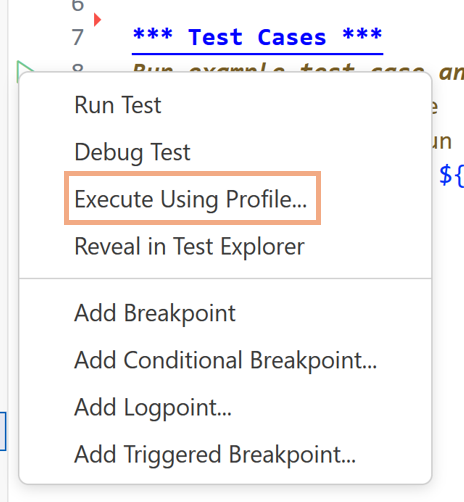
Right click on the Run test button on the same line where the test name is and choose Debug Test.
At this moment the test will start and execution will pause at the breakpoint that you have set before.
When paused, you can check & modify all variables, look at the call stack and step through the test case.
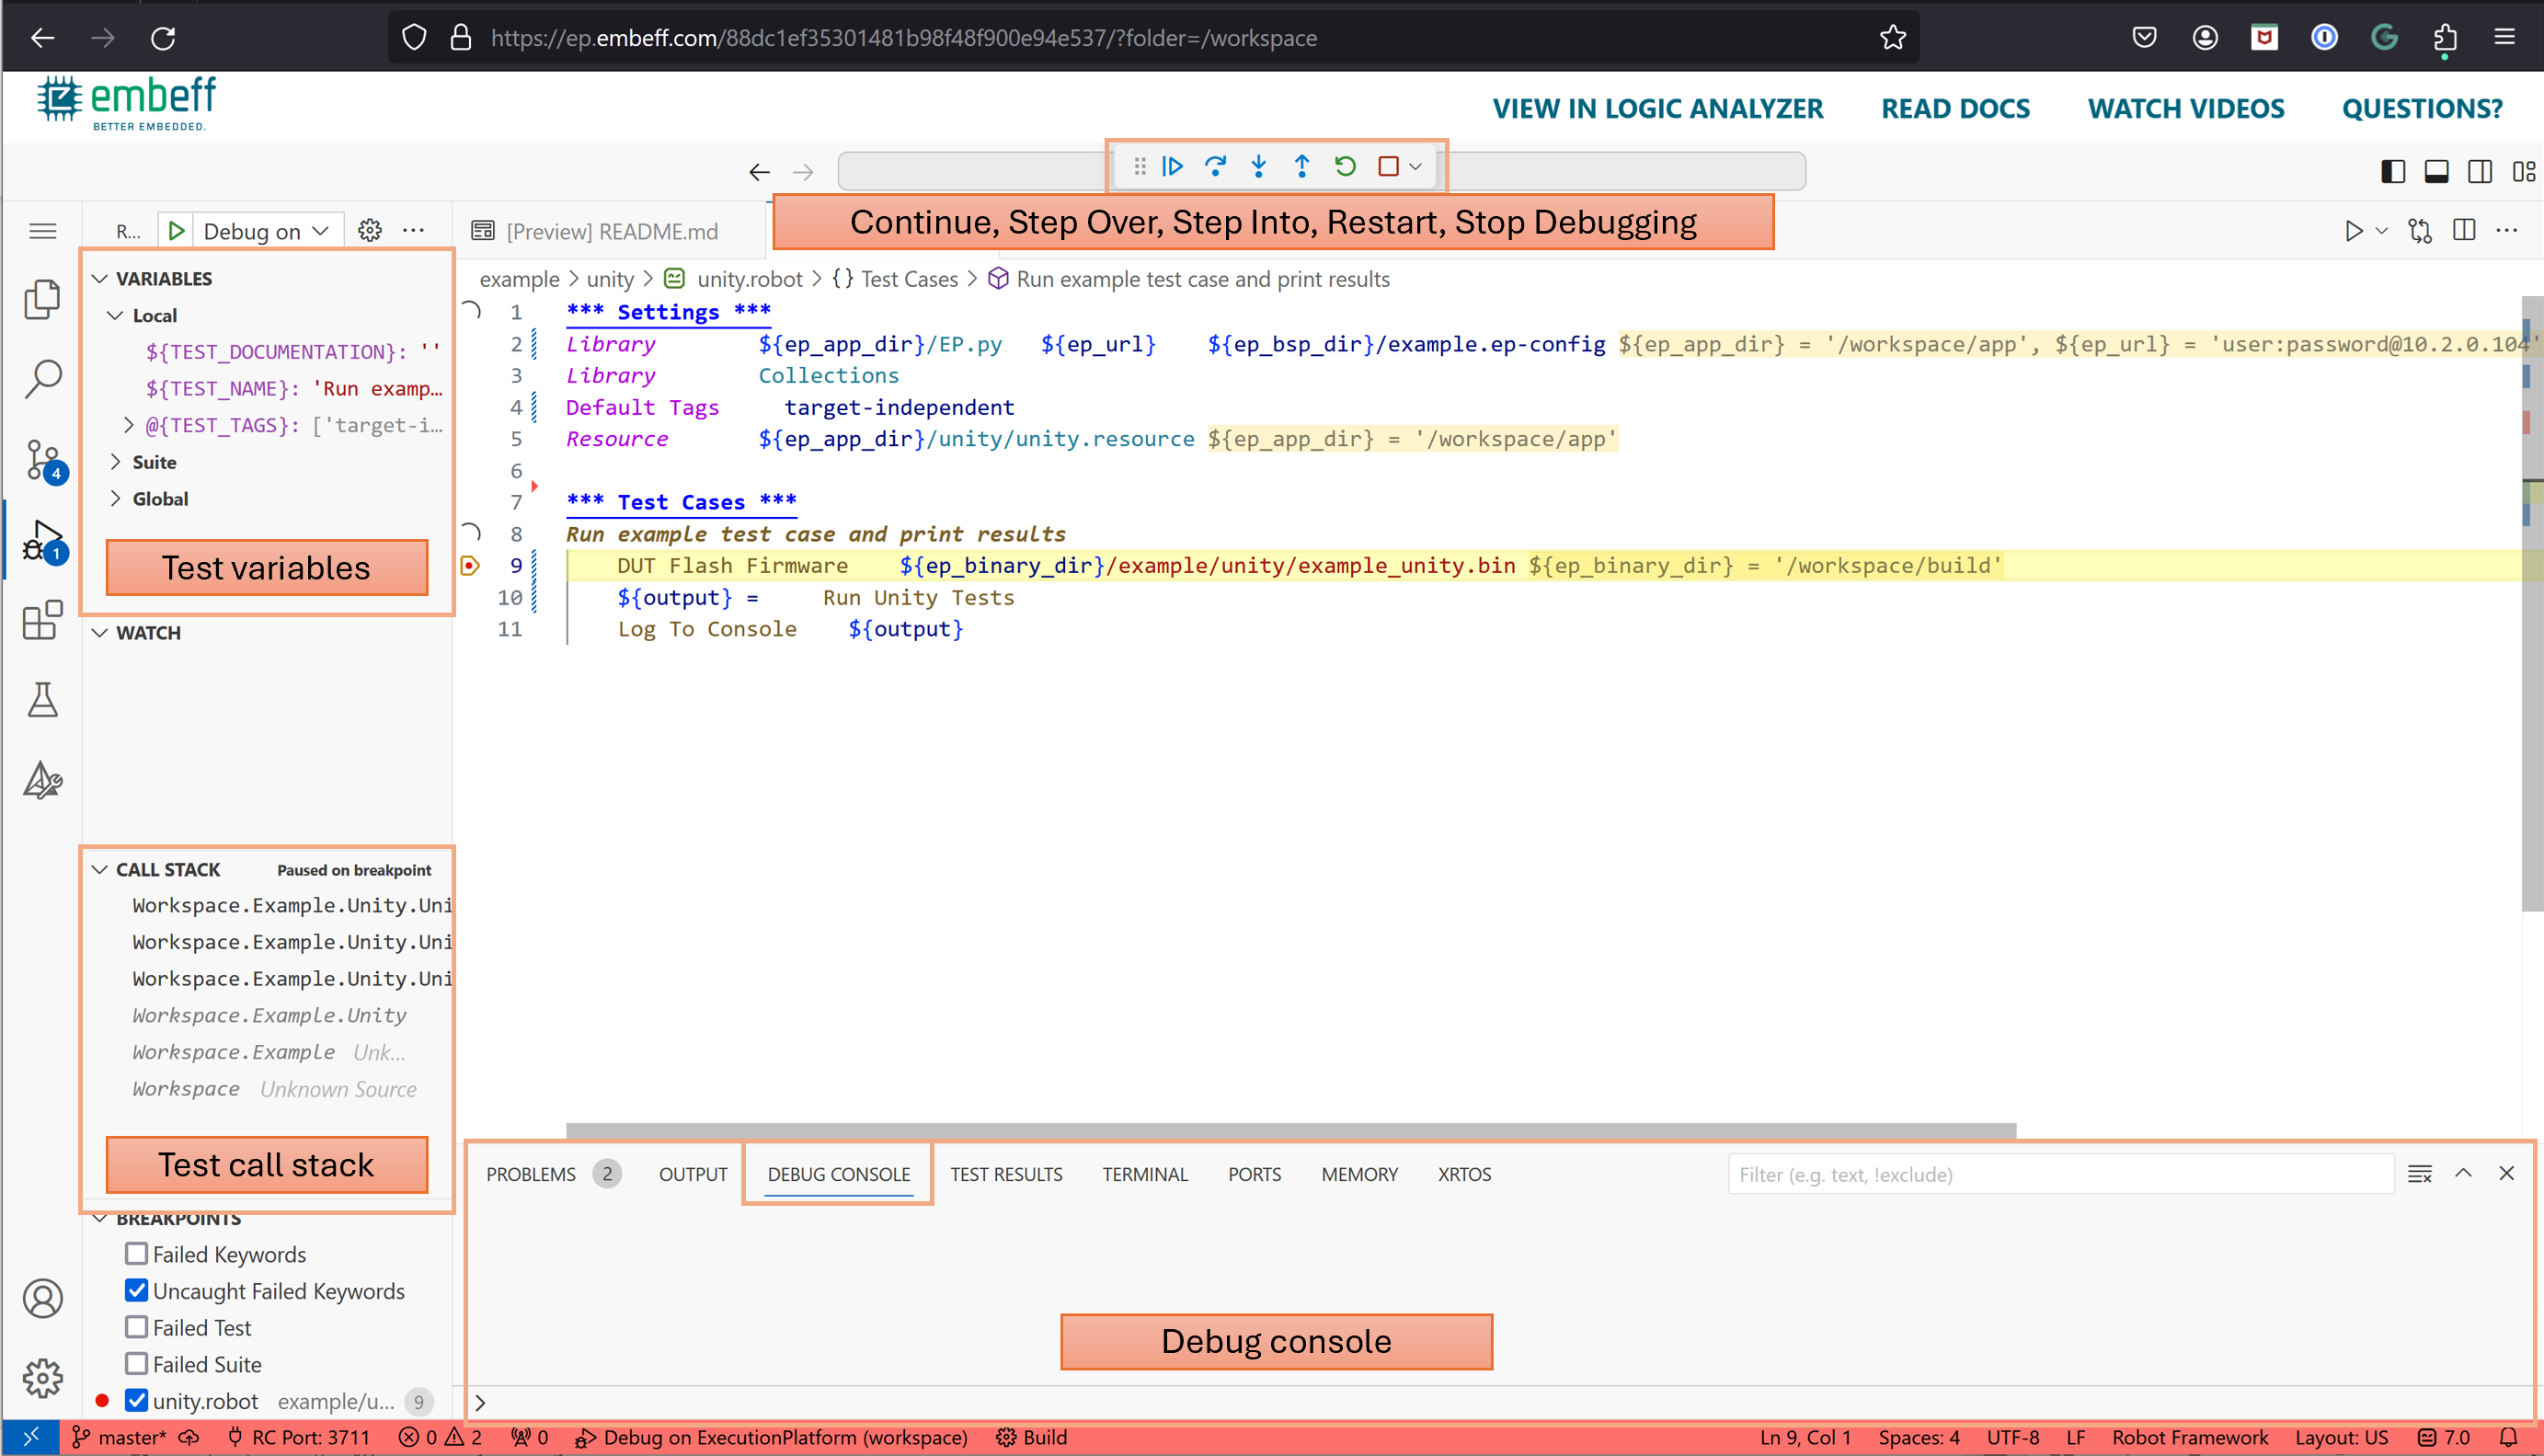
For some more advanced use-cases you can even execute keywords in the context of this running test case by using Debug Console, but this is out of scope for this article.
Debugging code running on MCU
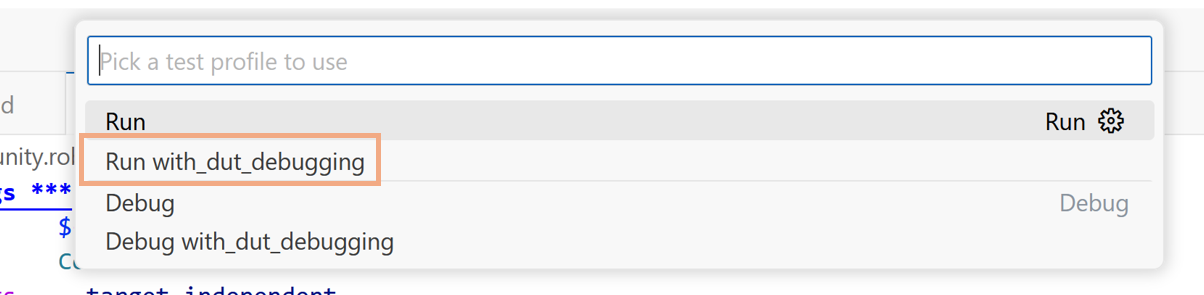
To start debugging firmware running on the MCU you need to right click on the Run test for a test that uses the firmware that you need to debug and choose Execute Using Profile... and then select Run with_dut_debugging from the list.
The test case will start and during execution of DUT Flash Firmware, the debugger will start and connect to the EP over network for MCU debugging.
The firmware will run until ep_app_main. You can put breakpoints in any place in the code to pause the execution.
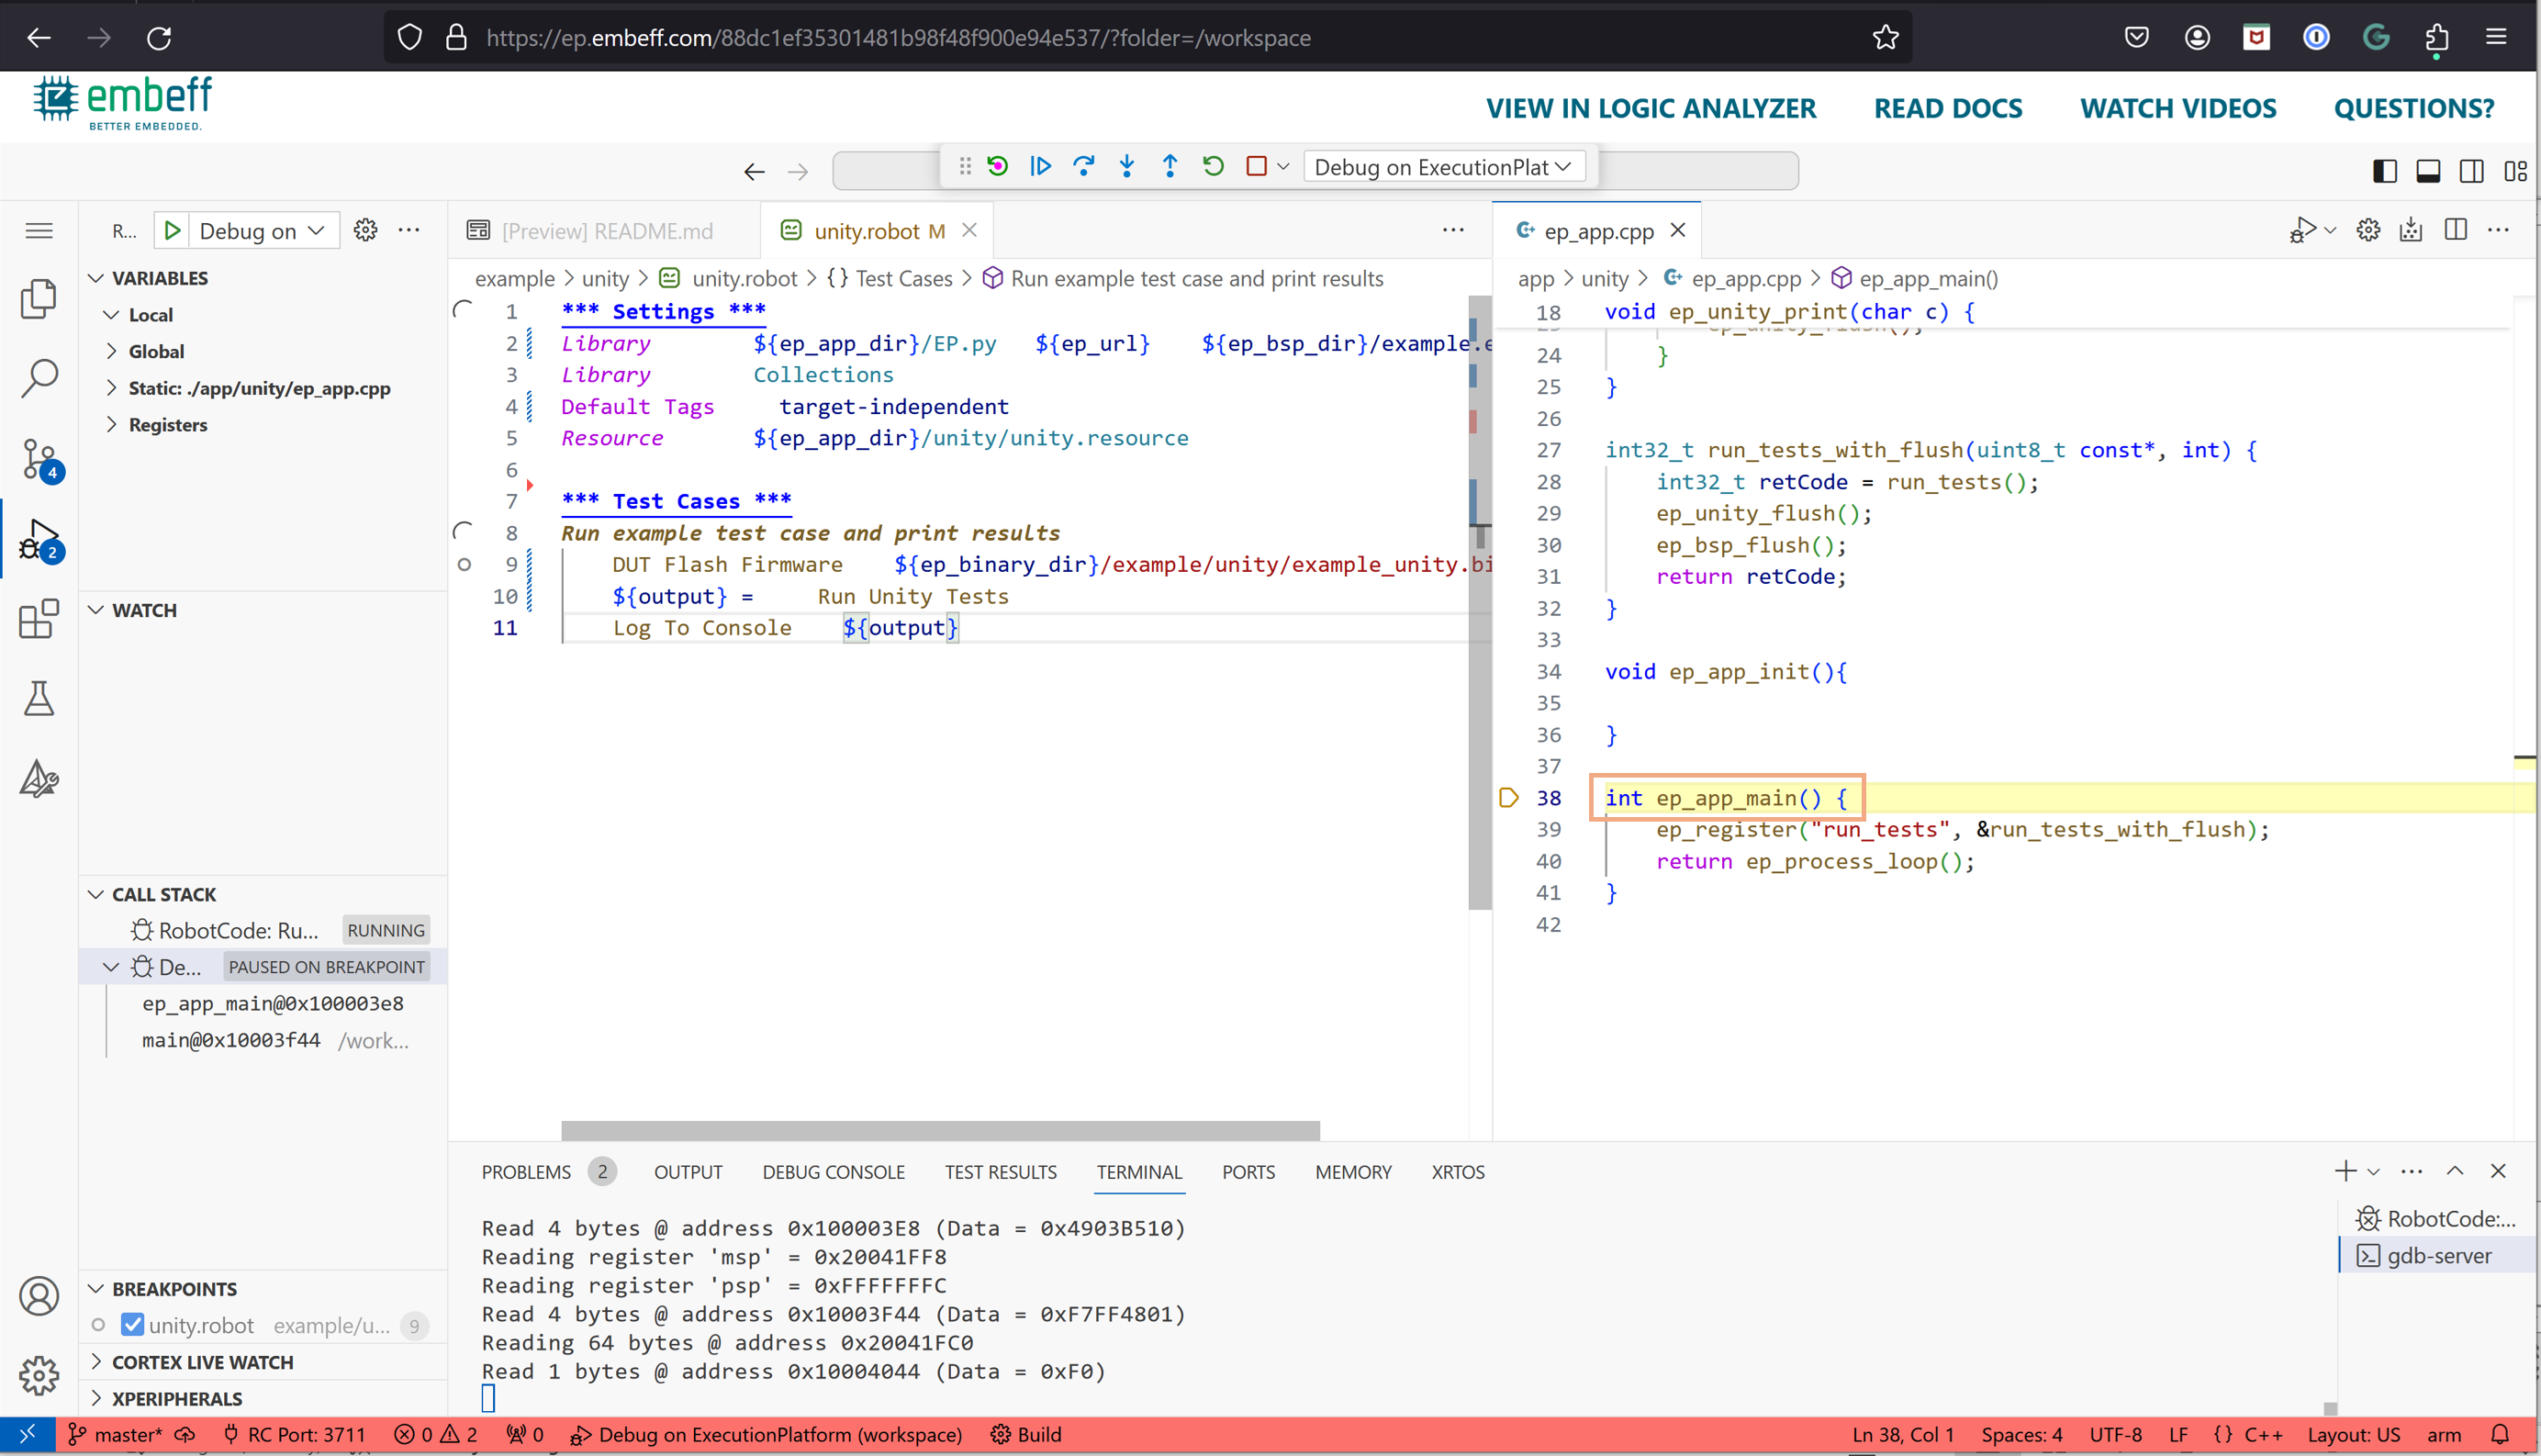
After hitting a breakpoint you can do the usual debugging tasks like looking at the variables, checking the call-stack and stepping through the code.
Debugging robot tests & MCU simultaneously
In edge cases you may need to debug Tests and MCU and the same time.
For that, click on Run test, select Execute Using Profile... and use the profile Debug with_dut_debugging.
This will start the debugger for the robot test cases. MCU debugging will be started automatically once your tests runs the DUT Flash Firmware keyword.
You can try everything described in this article by yourself. Just start a demo in your browser.
There are some examples available.